

Scientific diagram maker for papers, posters and slides
Describe a mechanism, a workflow or a model in one sentence. In one to two minutes you get an SVG figure with real text you can edit, ready for a paper, poster or slide. New accounts get 15 free credits, enough for your first figure.
Figure type
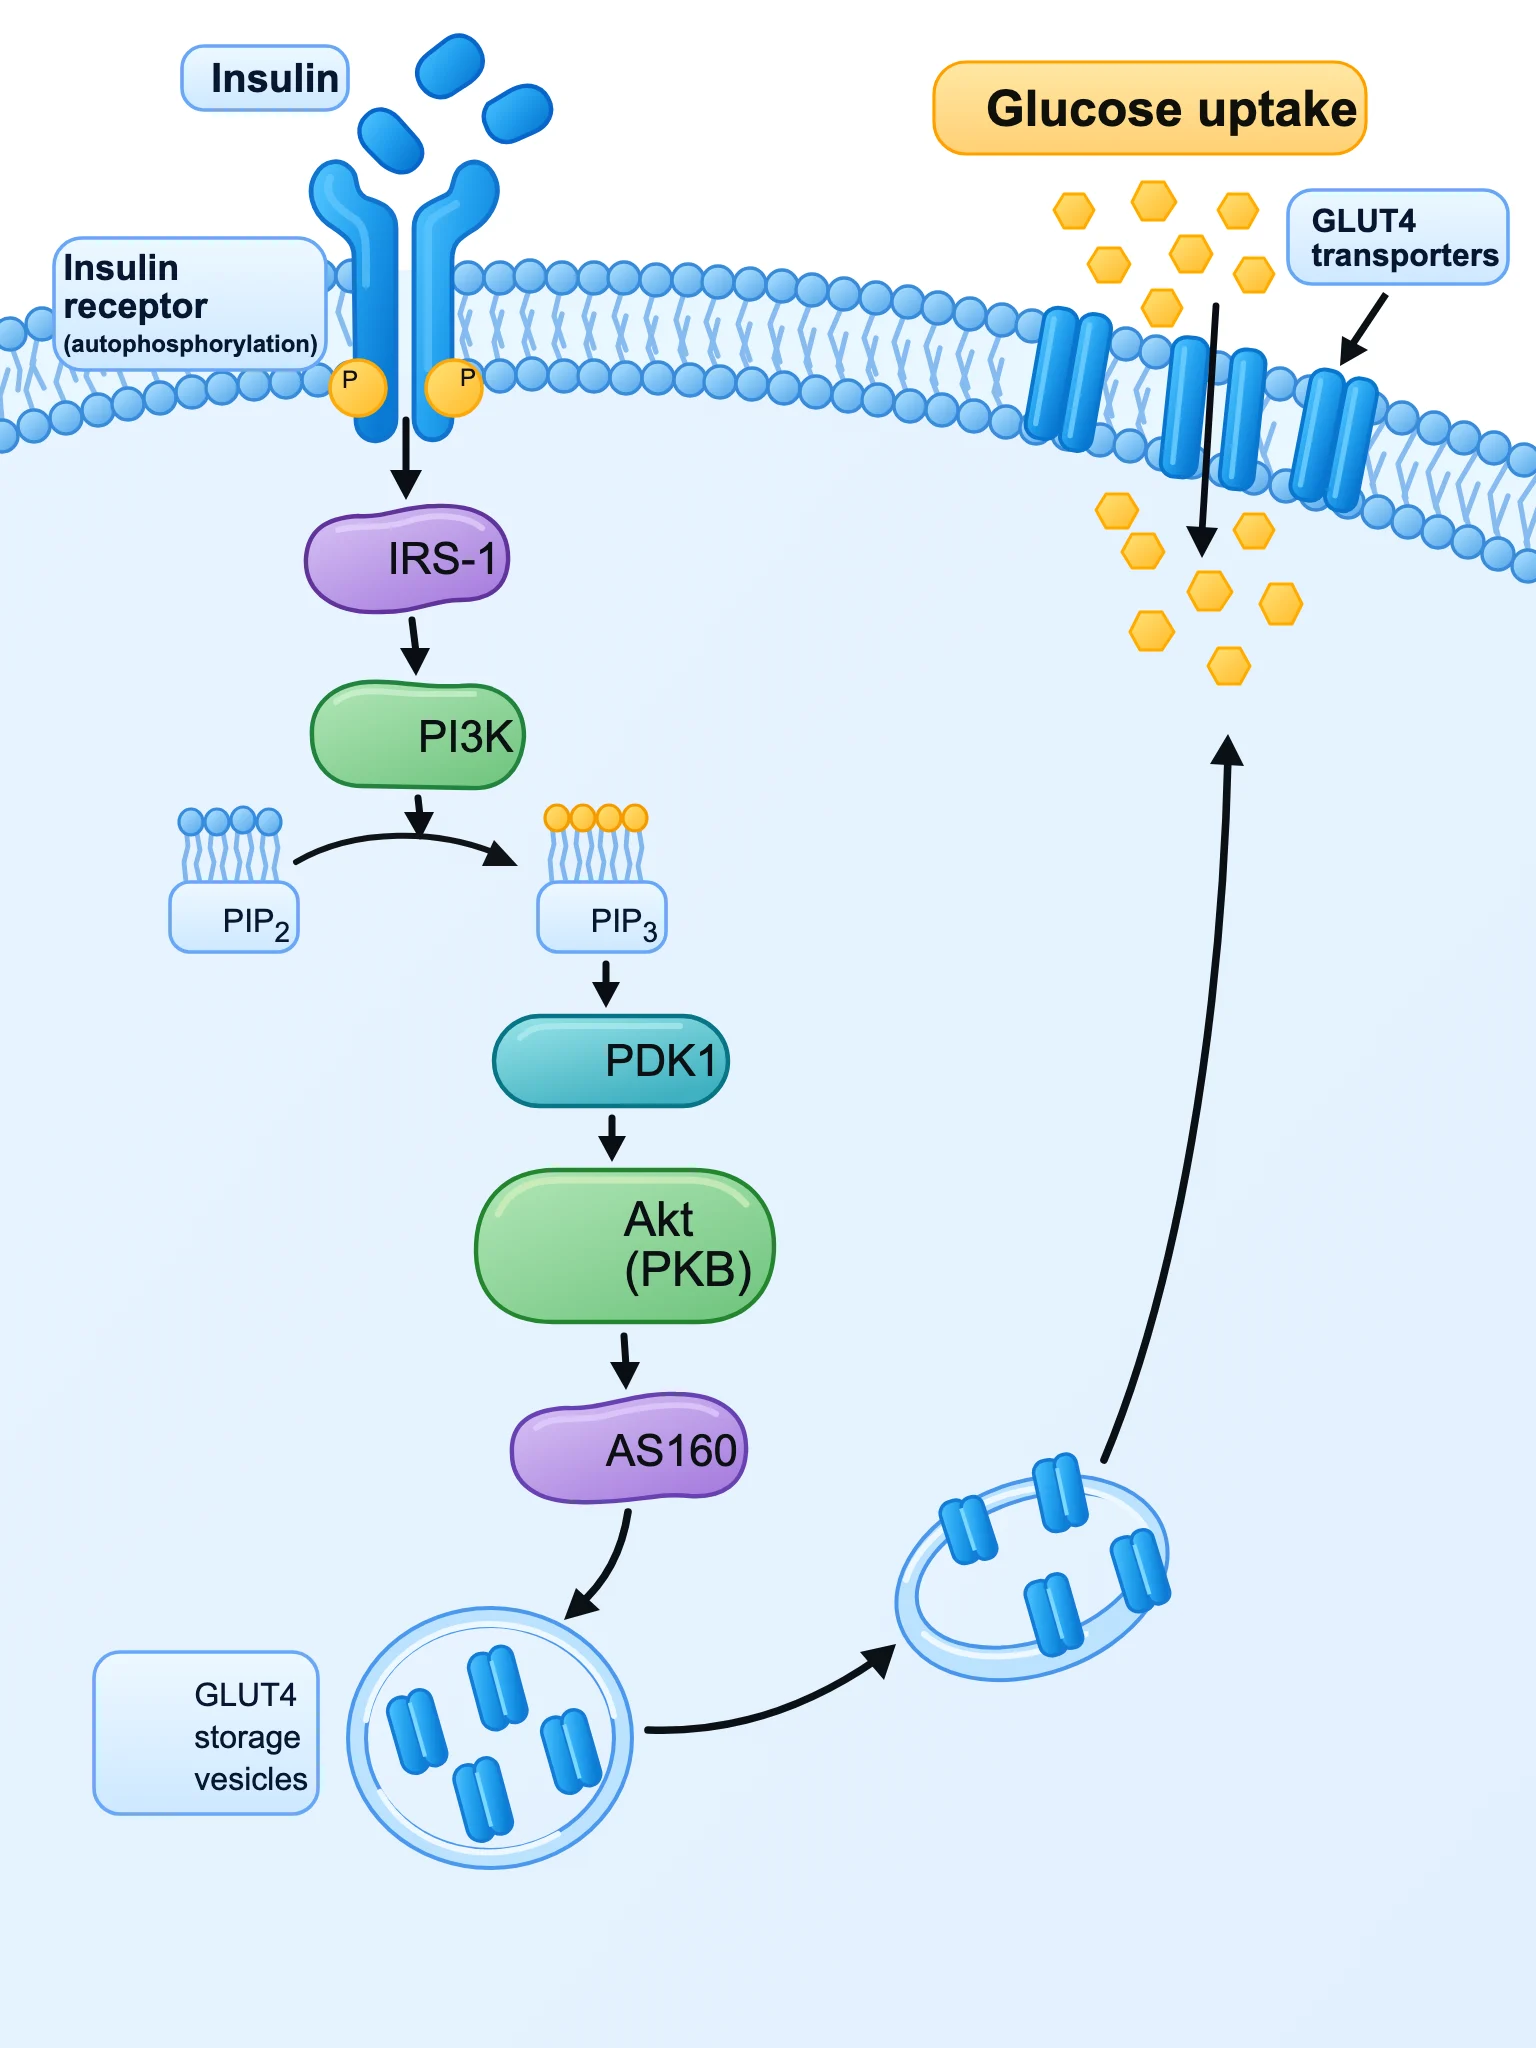
Cell signaling mechanism diagram, flat clean vector scientific illustration on white background. Show a cell membrane at the top with the insulin receptor binding insulin. Arrows down the cascade with labeled proteins: Insulin receptor (autophosphorylation, P), IRS-1, PI3K, PIP2 → PIP3, PDK1, Akt (PKB), AS160. Final step: GLUT4 storage vesicles moving to the membrane, and GLUT4 transporters in the membrane letting glucose enter the cell. Label 'Glucose uptake'. BioRender-like icons, sans-serif labels.
Scientific figure maker examples, each from one sentence
Six figures from our own test runs, each made from the single prompt shown. They appear as they open in the editor, after the automatic label fit. Each prompt spells out the style in full, so it works best with the Free description type; use it as it is, or change the subject and keep the structure.
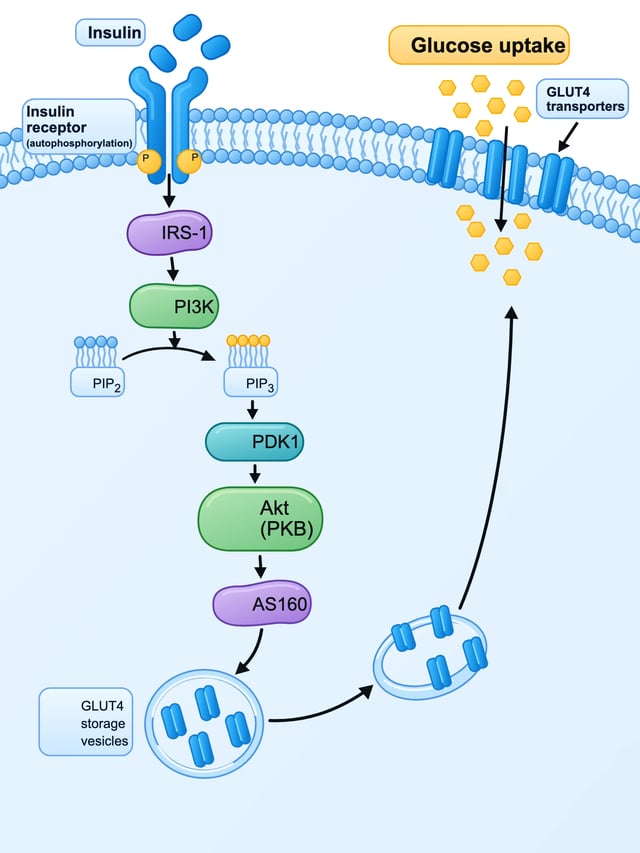
SciDiagram output Signaling mechanism: insulin to GLUT4
Prompt
Cell signaling mechanism diagram, flat clean vector scientific illustration on white background. Show a cell membrane at the top with the insulin receptor binding insulin. Arrows down the cascade with labeled proteins: Insulin receptor (autophosphorylation, P), IRS-1, PI3K, PIP2 → PIP3, PDK1, Akt (PKB), AS160. Final step: GLUT4 storage vesicles moving to the membrane, and GLUT4 transporters in the membrane letting glucose enter the cell. Label 'Glucose uptake'. BioRender-like icons, sans-serif labels.
- 3:4
- Figure: Mechanism / pathway
- Time: 118 s
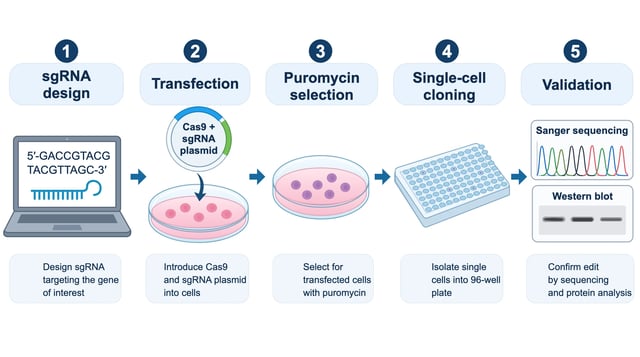
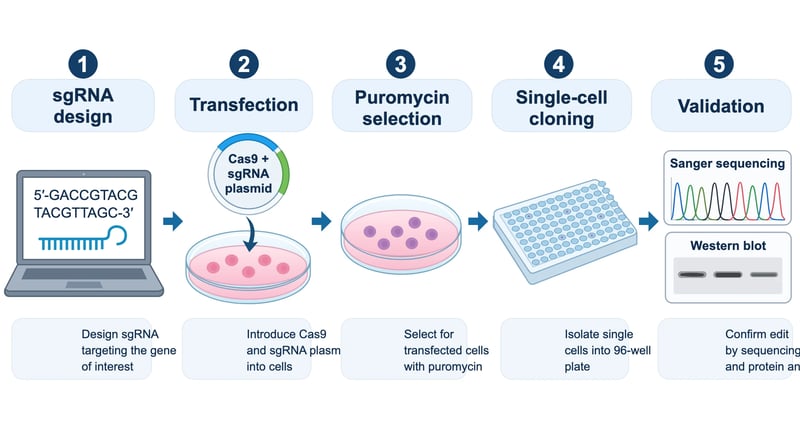
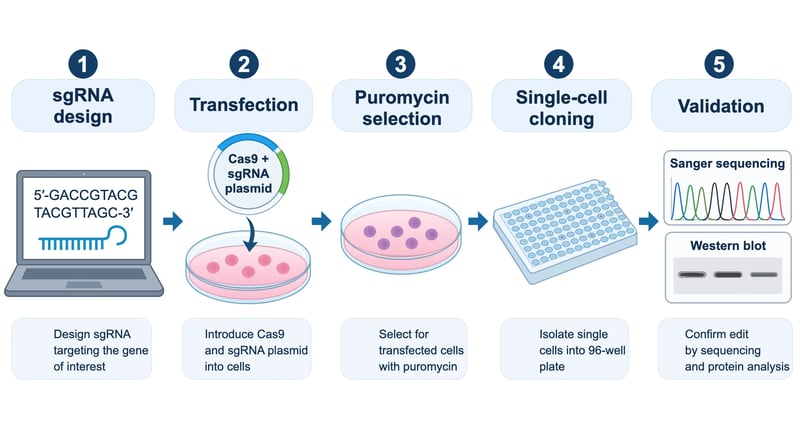
SciDiagram output Methods figure: CRISPR knockout workflow
Prompt
Lab protocol workflow figure for a methods section, flat clean vector icons on white background, five steps left to right with numbered arrows: 1 'sgRNA design' (computer screen with DNA sequence), 2 'Transfection' (Cas9 + sgRNA plasmid entering cells in a dish), 3 'Puromycin selection' (culture dish with surviving cells), 4 'Single-cell cloning' (96-well plate), 5 'Validation' (Sanger sequencing chromatogram and western blot). Short caption under each step, BioRender-like style, sans-serif labels.
- 16:9
- Figure: Experimental workflow
- Time: 99 s
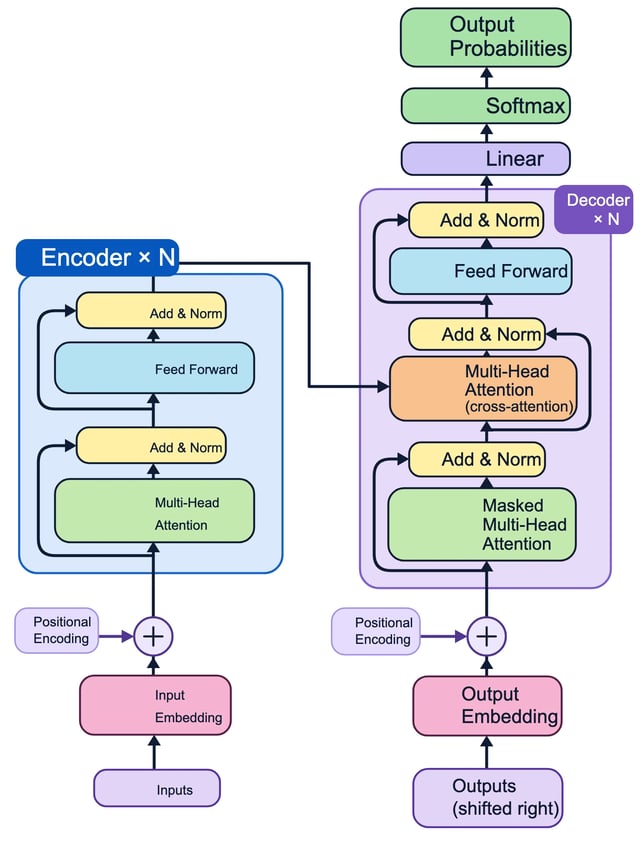
SciDiagram output Model architecture: the Transformer
Prompt
Machine learning paper figure, clean flat vector architecture diagram on white background: the Transformer encoder-decoder model. Left stack 'Encoder ×N': Input Embedding, Positional Encoding (⊕), Multi-Head Attention, Add & Norm, Feed Forward, Add & Norm. Right stack 'Decoder ×N': Output Embedding (shifted right), Positional Encoding, Masked Multi-Head Attention, Add & Norm, Multi-Head Attention (cross-attention from encoder), Add & Norm, Feed Forward, Add & Norm, then Linear, Softmax, Output Probabilities. Rounded rectangles in pastel colors, residual connection arrows, sans-serif labels.
- 3:4
- Figure: Model architecture
- Time: 49 s
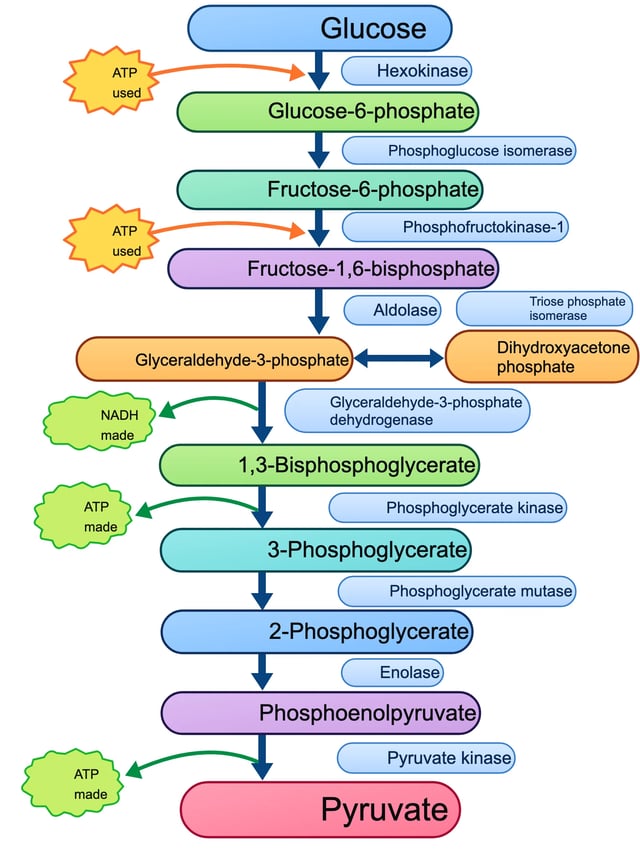
SciDiagram output Metabolic pathway: glycolysis with enzymes
Prompt
Biochemistry figure, clean flat vector pathway diagram on white background: the 10 steps of glycolysis as a vertical chain of molecule names connected by arrows. Molecules in order: Glucose, Glucose-6-phosphate, Fructose-6-phosphate, Fructose-1,6-bisphosphate, Glyceraldehyde-3-phosphate (with Dihydroxyacetone phosphate branch), 1,3-Bisphosphoglycerate, 3-Phosphoglycerate, 2-Phosphoglycerate, Phosphoenolpyruvate, Pyruvate. Label each arrow with its enzyme: Hexokinase, Phosphoglucose isomerase, Phosphofructokinase-1, Aldolase, Triose phosphate isomerase, Glyceraldehyde-3-phosphate dehydrogenase, Phosphoglycerate kinase, Phosphoglycerate mutase, Enolase, Pyruvate kinase. Mark ATP used (steps 1 and 3), NADH made (step 6), ATP made (steps 7 and 10) as small side arrows.
- 3:4
- Figure: Mechanism / pathway
- Time: 77 s
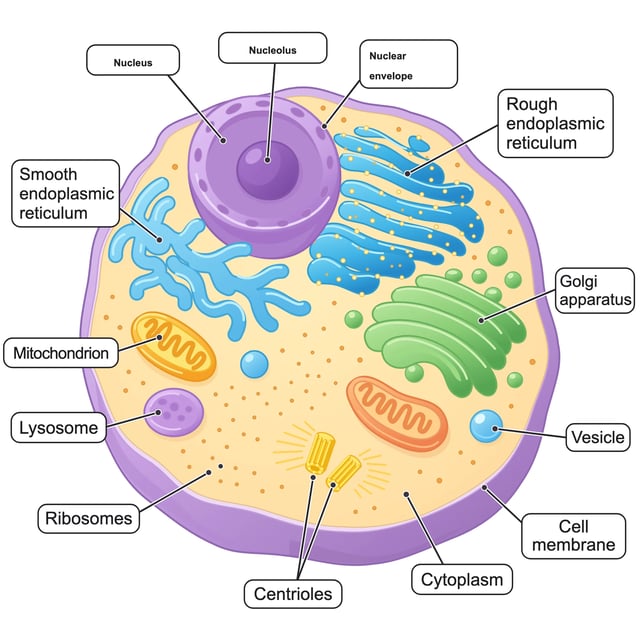
SciDiagram output Labeled diagram: the animal cell
Prompt
Biology textbook labeled diagram of an animal cell, cross-section, flat clean vector illustration with soft pastel colors on white background. Clear leader lines to labels: Nucleus, Nucleolus, Nuclear envelope, Rough endoplasmic reticulum, Smooth endoplasmic reticulum, Golgi apparatus, Mitochondrion, Lysosome, Ribosomes, Centrioles, Cell membrane, Cytoplasm, Vesicle. Sans-serif labels placed outside the cell.
- 1:1
- Figure: Labeled diagram
- Time: 192 s
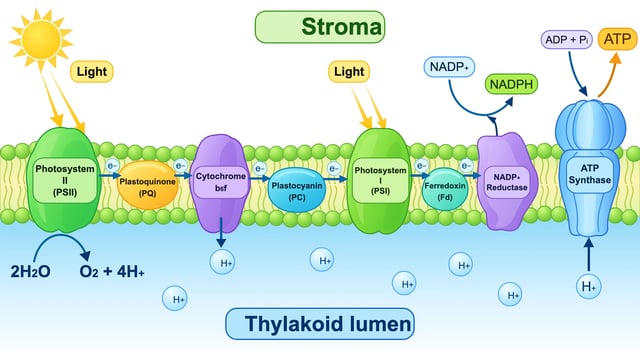
SciDiagram output Mechanism: the light-dependent reactions
Prompt
Plant biology diagram, flat clean vector scientific illustration on white background: the light-dependent reactions in the thylakoid membrane. Label 'Stroma' above and 'Thylakoid lumen' below the membrane. Embedded complexes from left to right: Photosystem II, Plastoquinone (PQ), Cytochrome b6f, Plastocyanin (PC), Photosystem I, Ferredoxin (Fd), NADP+ reductase, ATP synthase. Show light hitting PSII and PSI, water splitting 2H2O → O2 + 4H+ in the lumen, electron flow arrows (e−), H+ pumped into the lumen, NADP+ → NADPH in the stroma, and ADP + Pi → ATP at ATP synthase.
- 16:9
- Figure: Mechanism / pathway
- Time: 139 s
Edit the SVG in your browser, label by label
An AI scientific figure generator rarely gets everything right on the first try: a caption runs past its box, a label says the wrong thing, a colour clashes with your poster. SciDiagram keeps every label as real text, so you fix it in place instead of starting over.
When a figure opens in the editor, labels that spill out of the shape they sit on are shrunk and nudged back inside, never below half their size, and every line in one box shrinks by the same amount. Across our ten test figures that moved 74 labels. From there you can double-click any text to retype it, change fill and outline colours, font size and weight, bring parts forward or back, delete a part, drag it somewhere else, undo and redo, and save a version to come back to later.
How to use the science diagram maker in three steps
A figure maker for research papers, posters and lessons: no drawing skills needed, and nothing to install.
- 1
Pick a figure type and describe it
Choose mechanism or pathway, experimental workflow, model architecture, labeled diagram, or free description. Then name what the figure shows and the parts it needs, for example "insulin binding its receptor, IRS-1, PI3K, Akt, GLUT4 moving to the membrane". The figure type adds the layout and style instructions, so your sentence can stay about the science.
- 2
Wait one to two minutes
Most figures take one to two minutes; a dense one, like a labeled cell with a dozen organelles, can take about three. You can leave the page while it works and find it later in your assets.
- 3
Check the labels, edit, export
Open the result in the editor, read every label against what you know, fix what needs fixing, then download a PNG at 2x or 4x for slides, or, after any purchase, the editable SVG for Illustrator, Inkscape, Figma or PowerPoint.
SciDiagram at a glance
- Free to try
- Yes, 15 credits on sign-up, enough for one figure
- Sign-up uses a one-time code sent to your email.
- Time per figure
- About 90 seconds
- 35 to 192 seconds across our ten test runs.
- Output
- SVG with real text, plus PNG at 2x or 4x
- PNGs carry a watermark until your first purchase; the SVG download comes with any purchase.
- Shapes
- Landscape, square or portrait
- 4:3, 16:9, 1:1, 3:4 or 9:16, one figure per run.
- Figure types
- Mechanism or pathway, experimental workflow, model architecture, labeled diagram, free description
- Editing
- Text, colours, font size and weight, layer order, delete, move, undo, saved versions
- Where it runs
- In the browser, on a computer or a phone
- Nothing to install.
- Commercial use
- Figures made with paid credits can be used commercially; figures made only with free credits are for personal use
- Journals
- Check your publisher's AI policy and note the tool in the figure caption
Free tools for genetics and systematic reviews
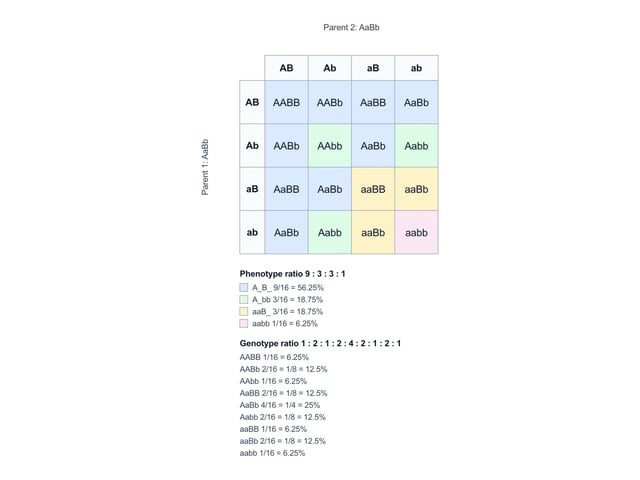
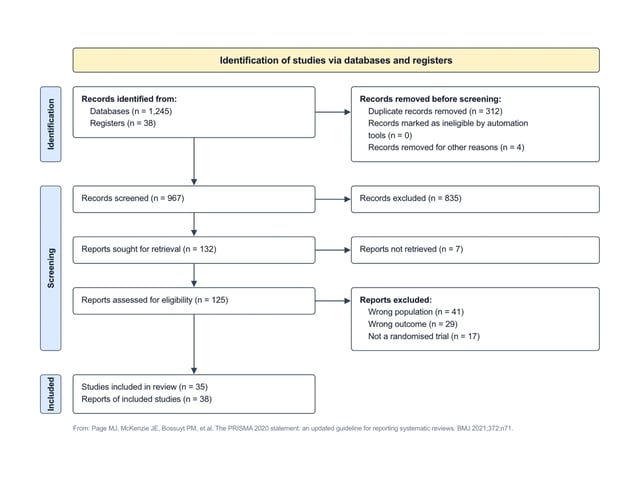
Some figures should be drawn by rules, not by a model. These two tools run in your browser, with no account and no credits, and export SVG or PNG.
Plans and credits
Every figure costs 15 credits. Plans refill each month; credit packs never expire.
- All models, including Premium
- All models, including Premium
- All models, including Premium
· No card required
Failed runs are refunded automatically · Cancel anytime
Questions about AI figures for research papers
Often yes for explanatory schematics, but rules differ by publisher, so check your journal's author guidelines before you submit. Elsevier's policy (June 2026) allows AI-made explanatory images such as flow charts, schematics and workflows, asks you to say in the caption which tool drafted them, and does not allow general-purpose AI tools for graphical abstracts or for images that show primary research data. Springer Nature only accepts AI visuals derived from verifiable inputs, such as diagrams built from your own content, and also asks for a note in the caption or legend. Whatever the journal, read every label yourself before you submit.
Not guaranteed. The model draws the labels, so treat a figure as a first draft from someone who knows the field but can slip. In our ten test figures the content was right, including the ten enzymes of glycolysis and the insulin-to-GLUT4 cascade, but that does not make every figure right. Read each label, fix anything that is off in the editor, and keep your own notes as the reference.
BioRender gives you a large icon library and you arrange the figure yourself. SciDiagram starts from one sentence and draws the whole figure, then lets you fix the text and colours. If you already know exactly where every icon goes, BioRender gives you more control; if you want a BioRender alternative that hands you a complete first draft in a couple of minutes, start here and edit.
New accounts get 15 free credits, which covers one figure at 15 credits. Figures made with free credits download as watermarked PNGs and are for personal use. After that, a plan or a credit pack adds more figures, removes the watermark and unlocks the SVG download.
An SVG whose labels are real text and whose shapes are paths and rectangles, not a picture wrapped in an SVG file. You can open it in Illustrator, Inkscape, Affinity Designer, Figma or PowerPoint and keep editing, or scale it to any size for a poster.
SciDiagram is best at schematics: signaling pathways and mechanisms, step-by-step lab workflows, model and system architectures, and textbook-style labeled diagrams. For data charts such as bar graphs or scatter plots, use your plotting software so the figure comes from your data. For Punnett squares and PRISMA diagrams, use the two free tools above, which follow the rules exactly.
About a minute and a half on average, and up to about three minutes for a dense figure with many labels.