

PRISMA flow diagram generator
Fill in the counts from your search and screening. The PRISMA flow diagram lays itself out, checks that every box adds up from the one before it, and downloads as an editable SVG or a PNG. Free, with no account.
PRISMA 2020 flow diagram
The numbers add up from box to box.
The paper needs another figure too?
Describe a mechanism, a study design or a methods workflow in one sentence and SciDiagram draws an editable diagram.
What goes in a PRISMA 2020 flow diagram
A PRISMA flow diagram shows how a systematic review got from everything its searches found to the studies it finally included. Reviewers and journal editors read it to see that nothing went missing between steps, so every box has to follow from the boxes before it.
This PRISMA flow diagram generator uses the PRISMA 2020 template for new systematic reviews that searched databases and registers. It has three stages. Identification counts the records found in databases and in registers, then the records removed before screening: duplicates, records marked ineligible by automation tools, and records removed for other reasons. Screening counts the records screened by title and abstract, the records excluded, the reports sought for retrieval, the reports not retrieved, the reports assessed for eligibility, and the reports excluded at that stage, each with its reason. Included gives the number of studies in the review and the number of reports of those studies.
The template for updated reviews and the version with a second column for other sources, such as websites, organisations or citation searching, are not built in yet. If your review used them, add the extra boxes to the downloaded SVG in a drawing app, or draw the diagram from the official template.
How to make a PRISMA flow chart in three steps
Every PRISMA flow chart starts from your screening log, so keep it or your reference manager open next to the form.
- 1
Enter the counts, box by box
Type each number from your search and screening records. Type 0 for a box that does not apply, such as automation tools you did not use; a box left blank prints as (n = ) and is skipped by the checks. Load an example to see a complete review first, or clear the form to start over.
- 2
List the reasons for excluding reports
For the full-text stage, add one row per reason with its count, for example wrong population, wrong outcome or wrong study design. The diagram prints them in the box for excluded reports, in the order you entered them.
- 3
Fix any mismatch, then download
When a box does not equal the sum of the boxes before it, a note shows the arithmetic and a button fills in the expected value. Once the numbers add up, download the SVG to edit in Illustrator, Inkscape or PowerPoint, or a PNG for your manuscript or protocol.
How the PRISMA diagram generator checks your numbers
A number that does not add up is the most common reason a reviewer queries a flow diagram. These are the checks it runs as you type.
Records screened = records from databases + registers − records removed before screening
- If it fails
- Recount duplicates and other removals; a reference manager's duplicate report usually holds the missing number.
- What it does not judge
- Whether your search strategy was complete.
Reports sought = records screened − records excluded
- If it fails
- Check that every screened record was either excluded or carried forward.
- What it does not judge
- Why records were excluded at title and abstract; PRISMA 2020 does not ask for reasons there.
Reports assessed = reports sought − reports not retrieved
- If it fails
- Count the full texts you could not obtain separately from the ones you excluded.
- What it does not judge
- How hard you tried to retrieve them.
Reports of included studies = reports assessed − reports excluded, by reason
- If it fails
- Make the reasons add up to every report you excluded, one reason per report.
- What it does not judge
- How reports group into studies; it only flags more studies than reports, since one study can have several papers.
PRISMA flow diagram generator at a glance
- Price
- Free, no account
- It runs in your browser and uses no credits.
- Template
- PRISMA 2020, new reviews, databases and registers
- Number checks
- Box-to-box sums, negative counts, studies against reports
- Exclusion reasons
- As many as you need, each with a count
- Downloads
- SVG with editable text, and PNG
- How it is drawn
- By the template's rules from your numbers, not by AI
PRISMA flow diagram questions
PRISMA 2020 separates records, which you screen by title and abstract, from reports, which are the full texts you retrieve and assess. It adds registers as a search source next to databases, splits the records removed before screening into duplicates, automation tools and other reasons, and adds boxes for reports sought and reports not retrieved. The 2009 boxes for qualitative and quantitative synthesis are replaced by studies included in the review and reports of included studies. There are also separate 2020 templates for updated reviews and for reviews that searched other sources.
PRISMA 2020 asks for reasons only at the full-text stage. List each reason with the number of reports excluded for it, such as "Wrong population (n = 41)", and make sure each excluded report is counted under one reason, so that the reasons add up to the total excluded. Records excluded at title and abstract screening need only a total.
The generator shows which box is off and the sum it expected, for example "Records screened is 970, but the boxes before it give 967 (1,245 + 38 − 316 = 967)". Usually a removal was counted twice or a record was dropped without being logged. Fix the count in your records first, then use the suggested value or type the corrected one.
No AI is involved. The diagram is drawn by fixed rules from the numbers you type, the same way you would fill in the official PRISMA template, so journal policies on AI-generated images do not apply to it. Check your journal's instructions for figure format and size.
Yes. The SVG keeps every box label as real text, so you can change wording, fonts or colours in Illustrator, Inkscape, Affinity Designer or PowerPoint, or add boxes for other sources. The PNG is ready to drop into a manuscript or a slide as it is.
No. The PRISMA flow diagram generator works without signing in and never uses credits. An account is only needed for the AI figure generator, which draws other paper figures, such as a mechanism, a study design or a methods workflow, from one sentence.
More free science tools
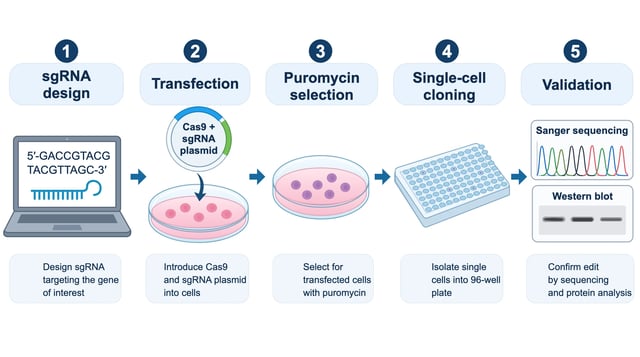
Edit SVG online, label by label
Pick one of our example figures or open your own SVG file. Click a label to retype it, change colours and font size, move parts, then download a PNG or the edited SVG. Editing is free and needs no account.
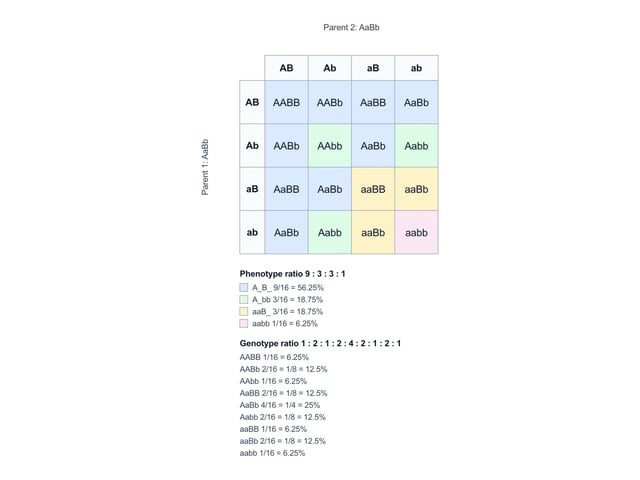
Punnett square generator
Enter two parent genotypes for one gene or two. The Punnett square, the genotype and phenotype ratios and each probability update as you type. Free, with no account and no credits; download the square as SVG or PNG.