

Create a scientific figure
Pick a figure type and describe it in one sentence. You get an SVG you can edit, in about a minute and a half.
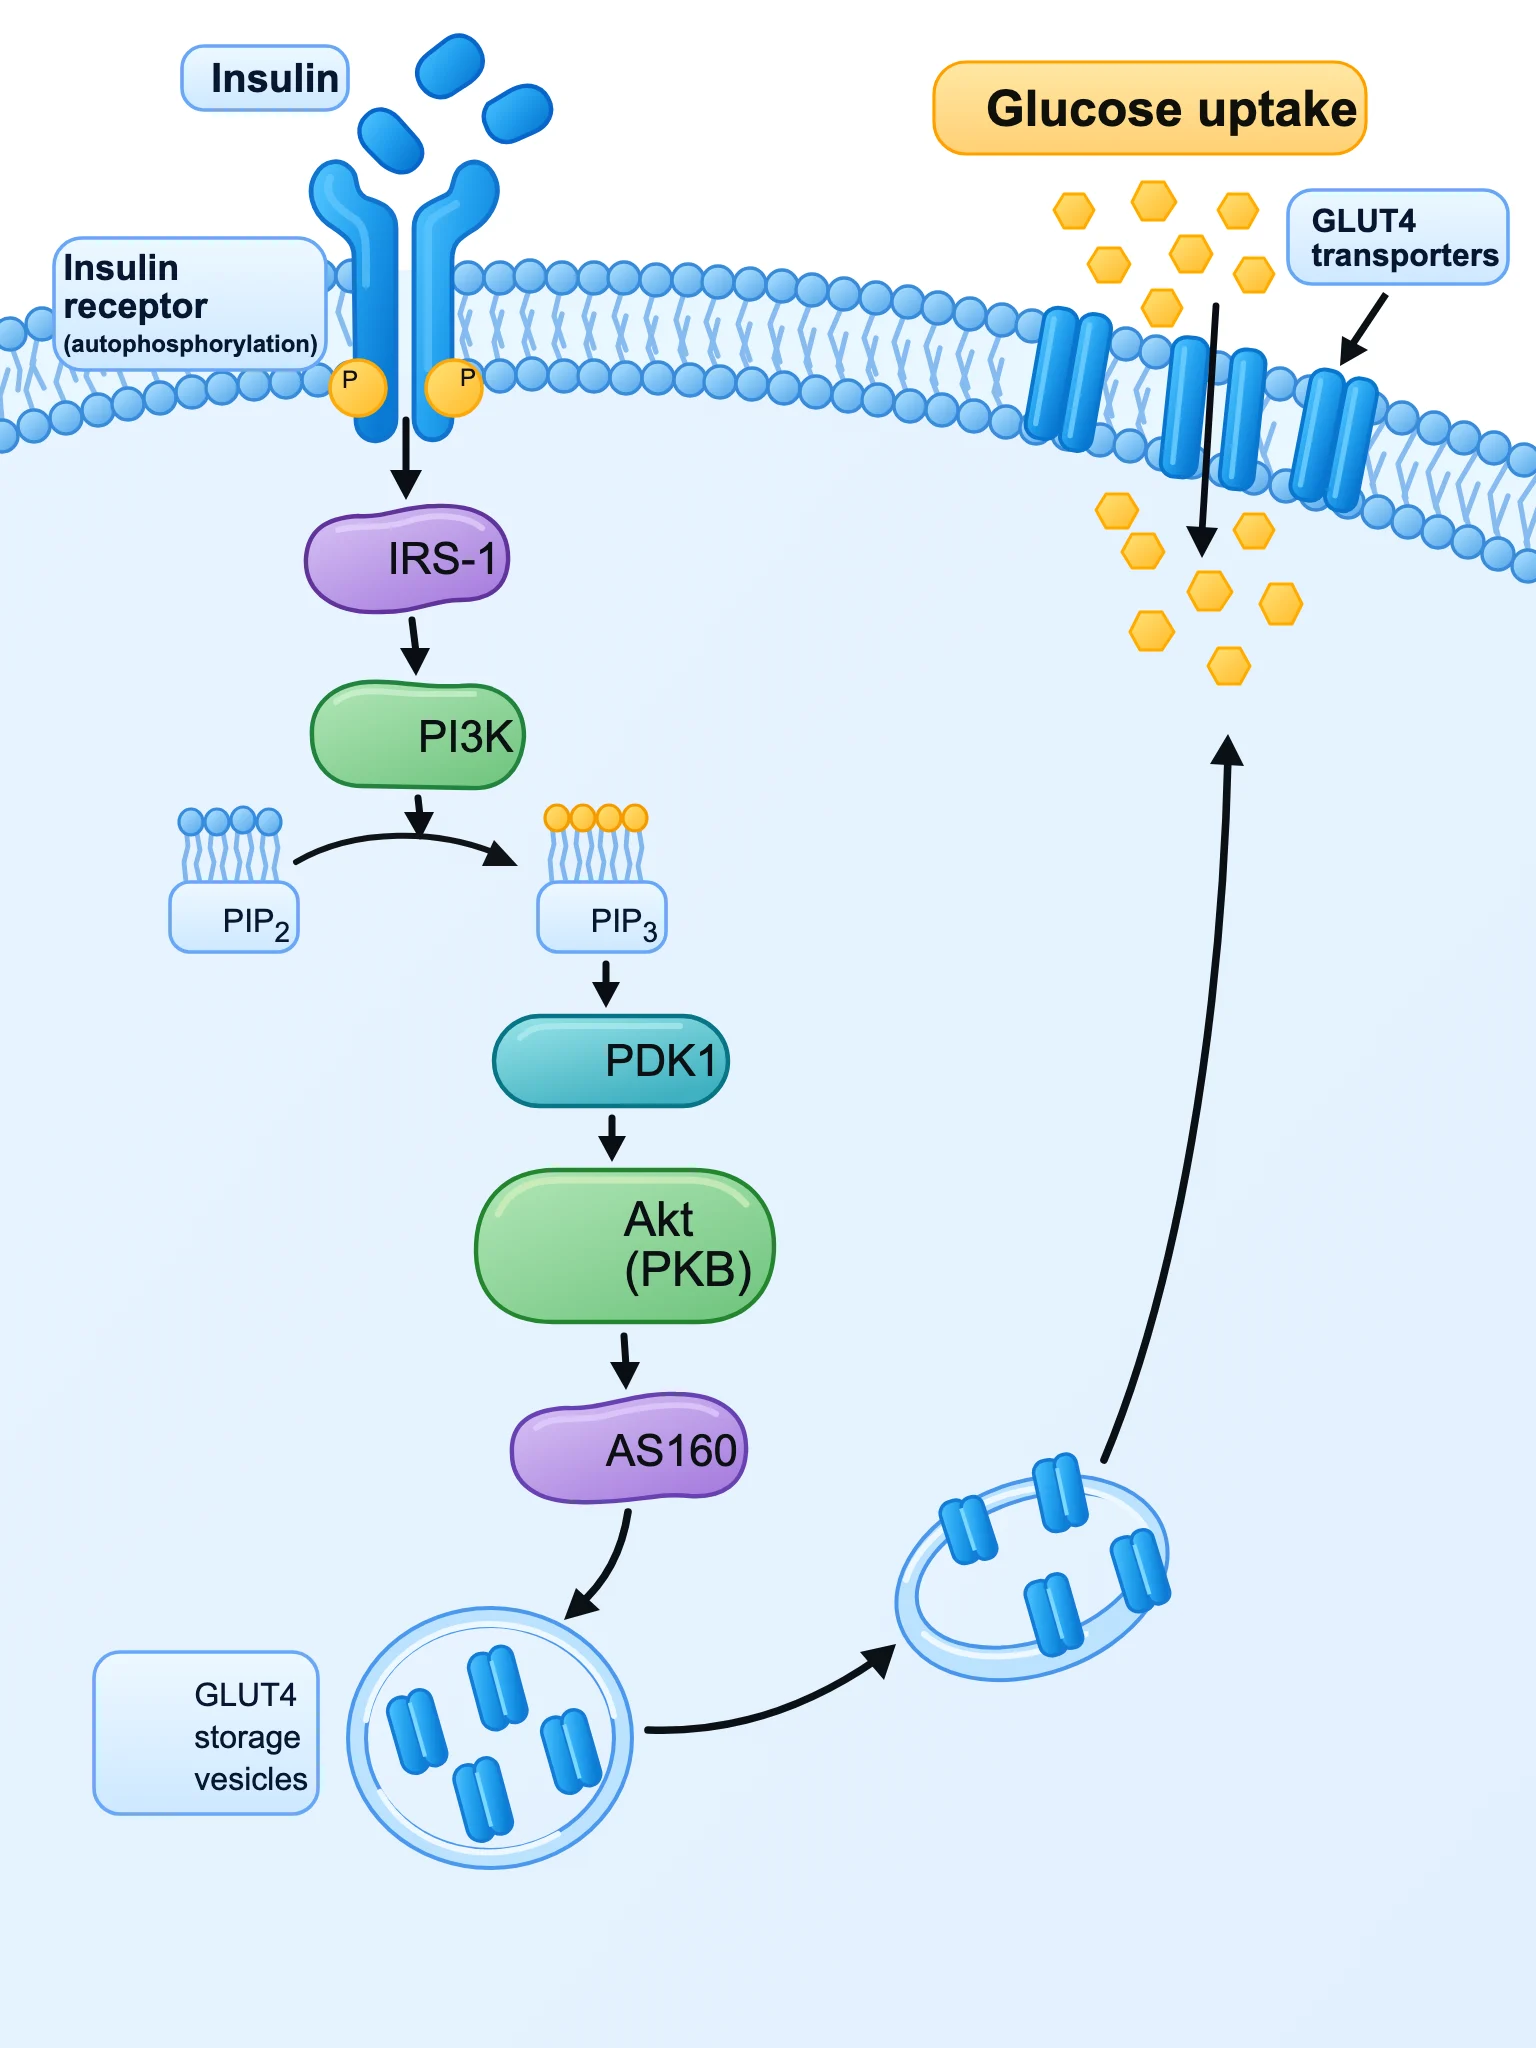
Cell signaling mechanism diagram, flat clean vector scientific illustration on white background. Show a cell membrane at the top with the insulin receptor binding insulin. Arrows down the cascade with labeled proteins: Insulin receptor (autophosphorylation, P), IRS-1, PI3K, PIP2 → PIP3, PDK1, Akt (PKB), AS160. Final step: GLUT4 storage vesicles moving to the membrane, and GLUT4 transporters in the membrane letting glucose enter the cell. Label 'Glucose uptake'. BioRender-like icons, sans-serif labels.
Create a figure examples
 SciDiagram
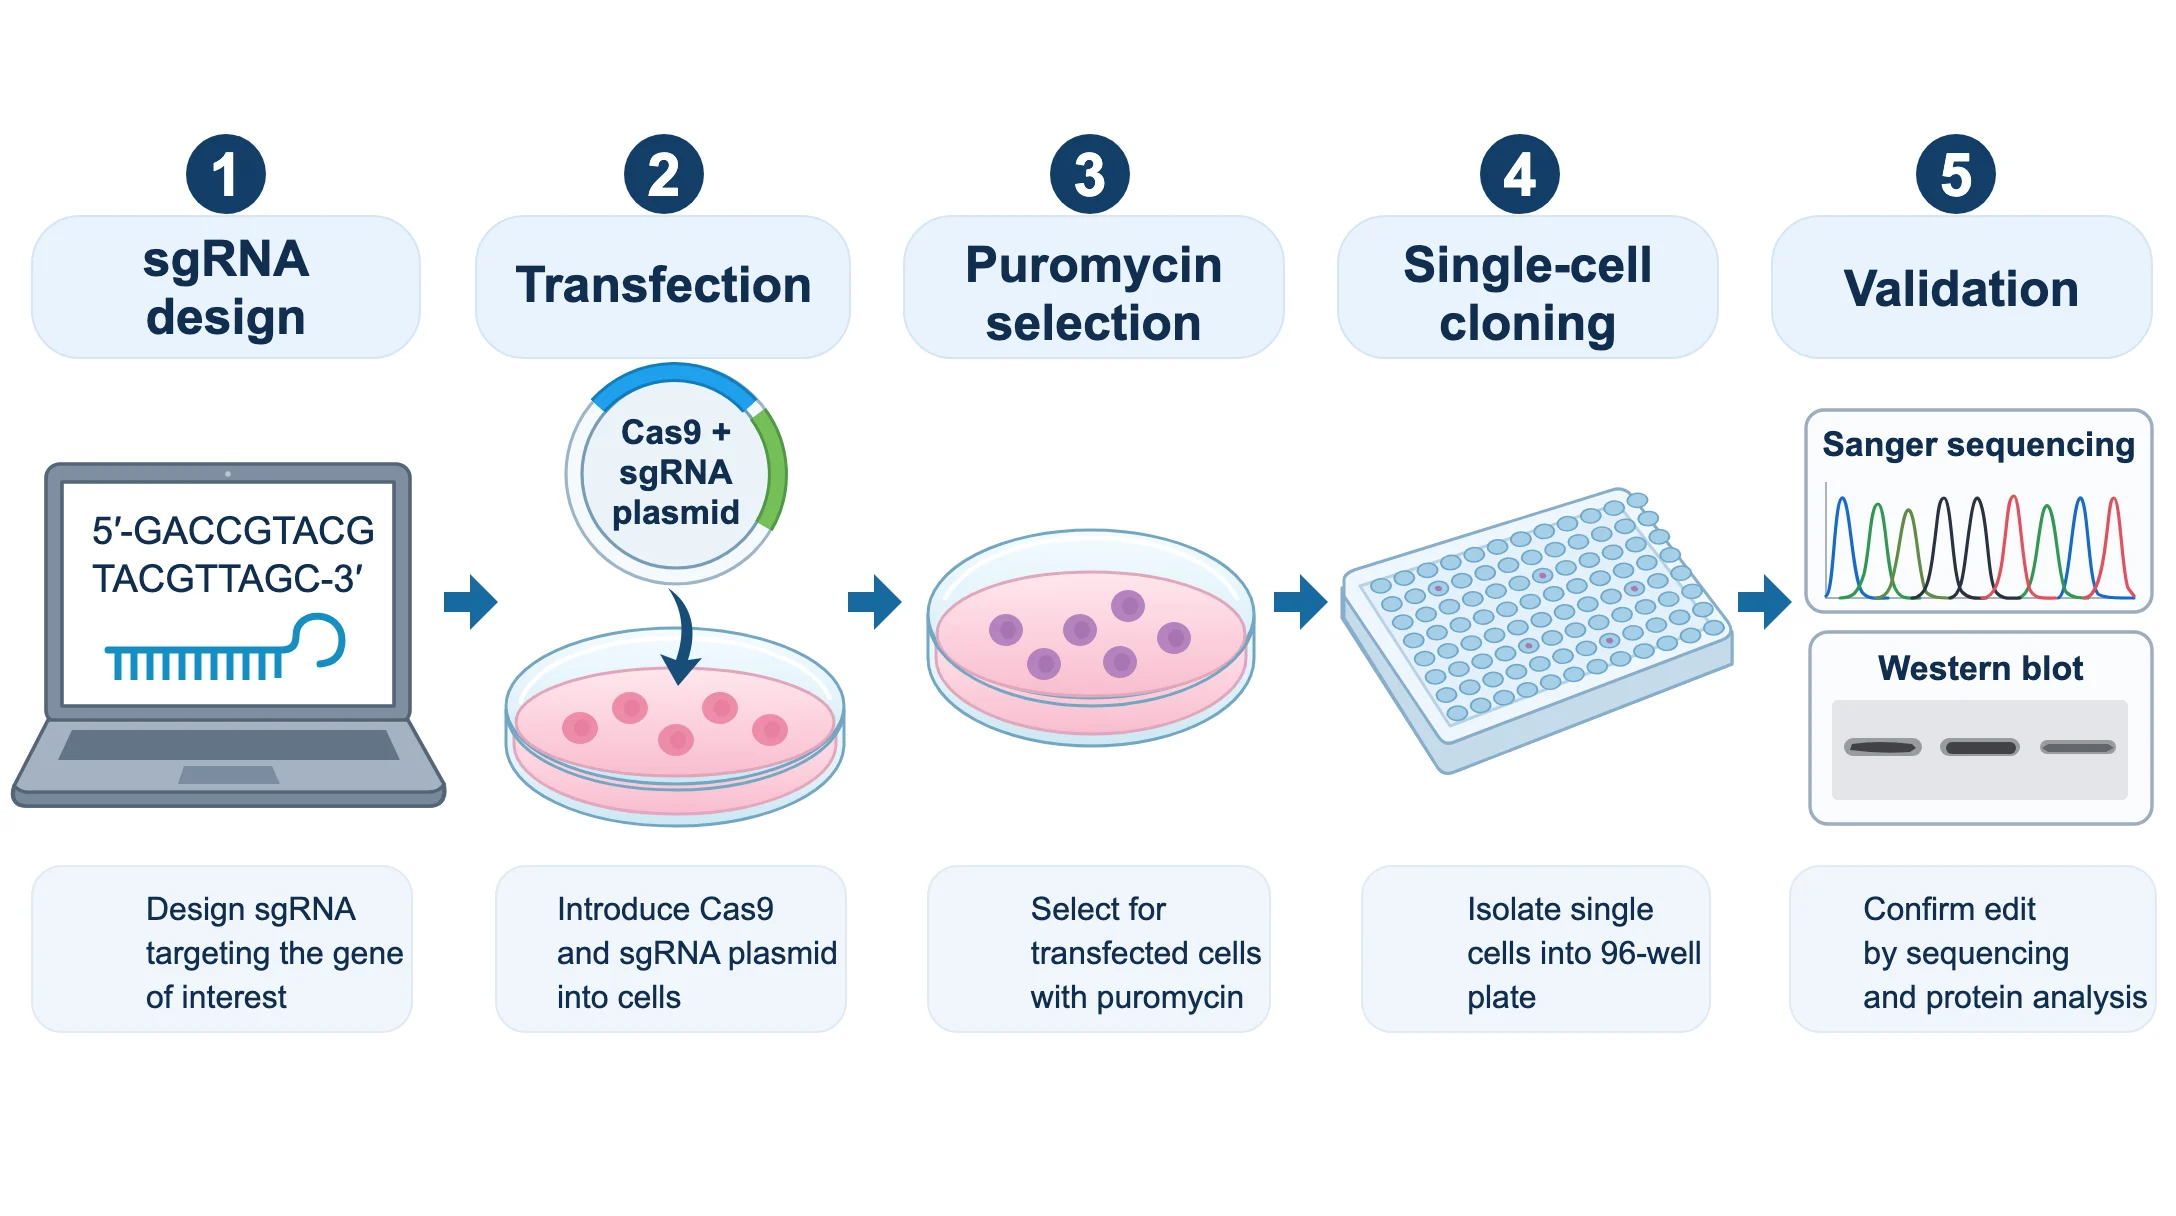
Lab protocol workflow figure for a methods section, flat clean vector icons on white background, five steps left to right with numbered arrows: 1 'sgRNA design' (computer screen with DNA sequence), 2 'Transfection' (Cas9 + sgRNA plasmid entering cells in a dish), 3 'Puromycin selection' (culture dish with surviving cells), 4 'Single-cell cloning' (96-well plate), 5 'Validation' (Sanger sequencing chromatogram and western blot). Short caption under each step, BioRender-like style, sans-serif labels.
 SciDiagram
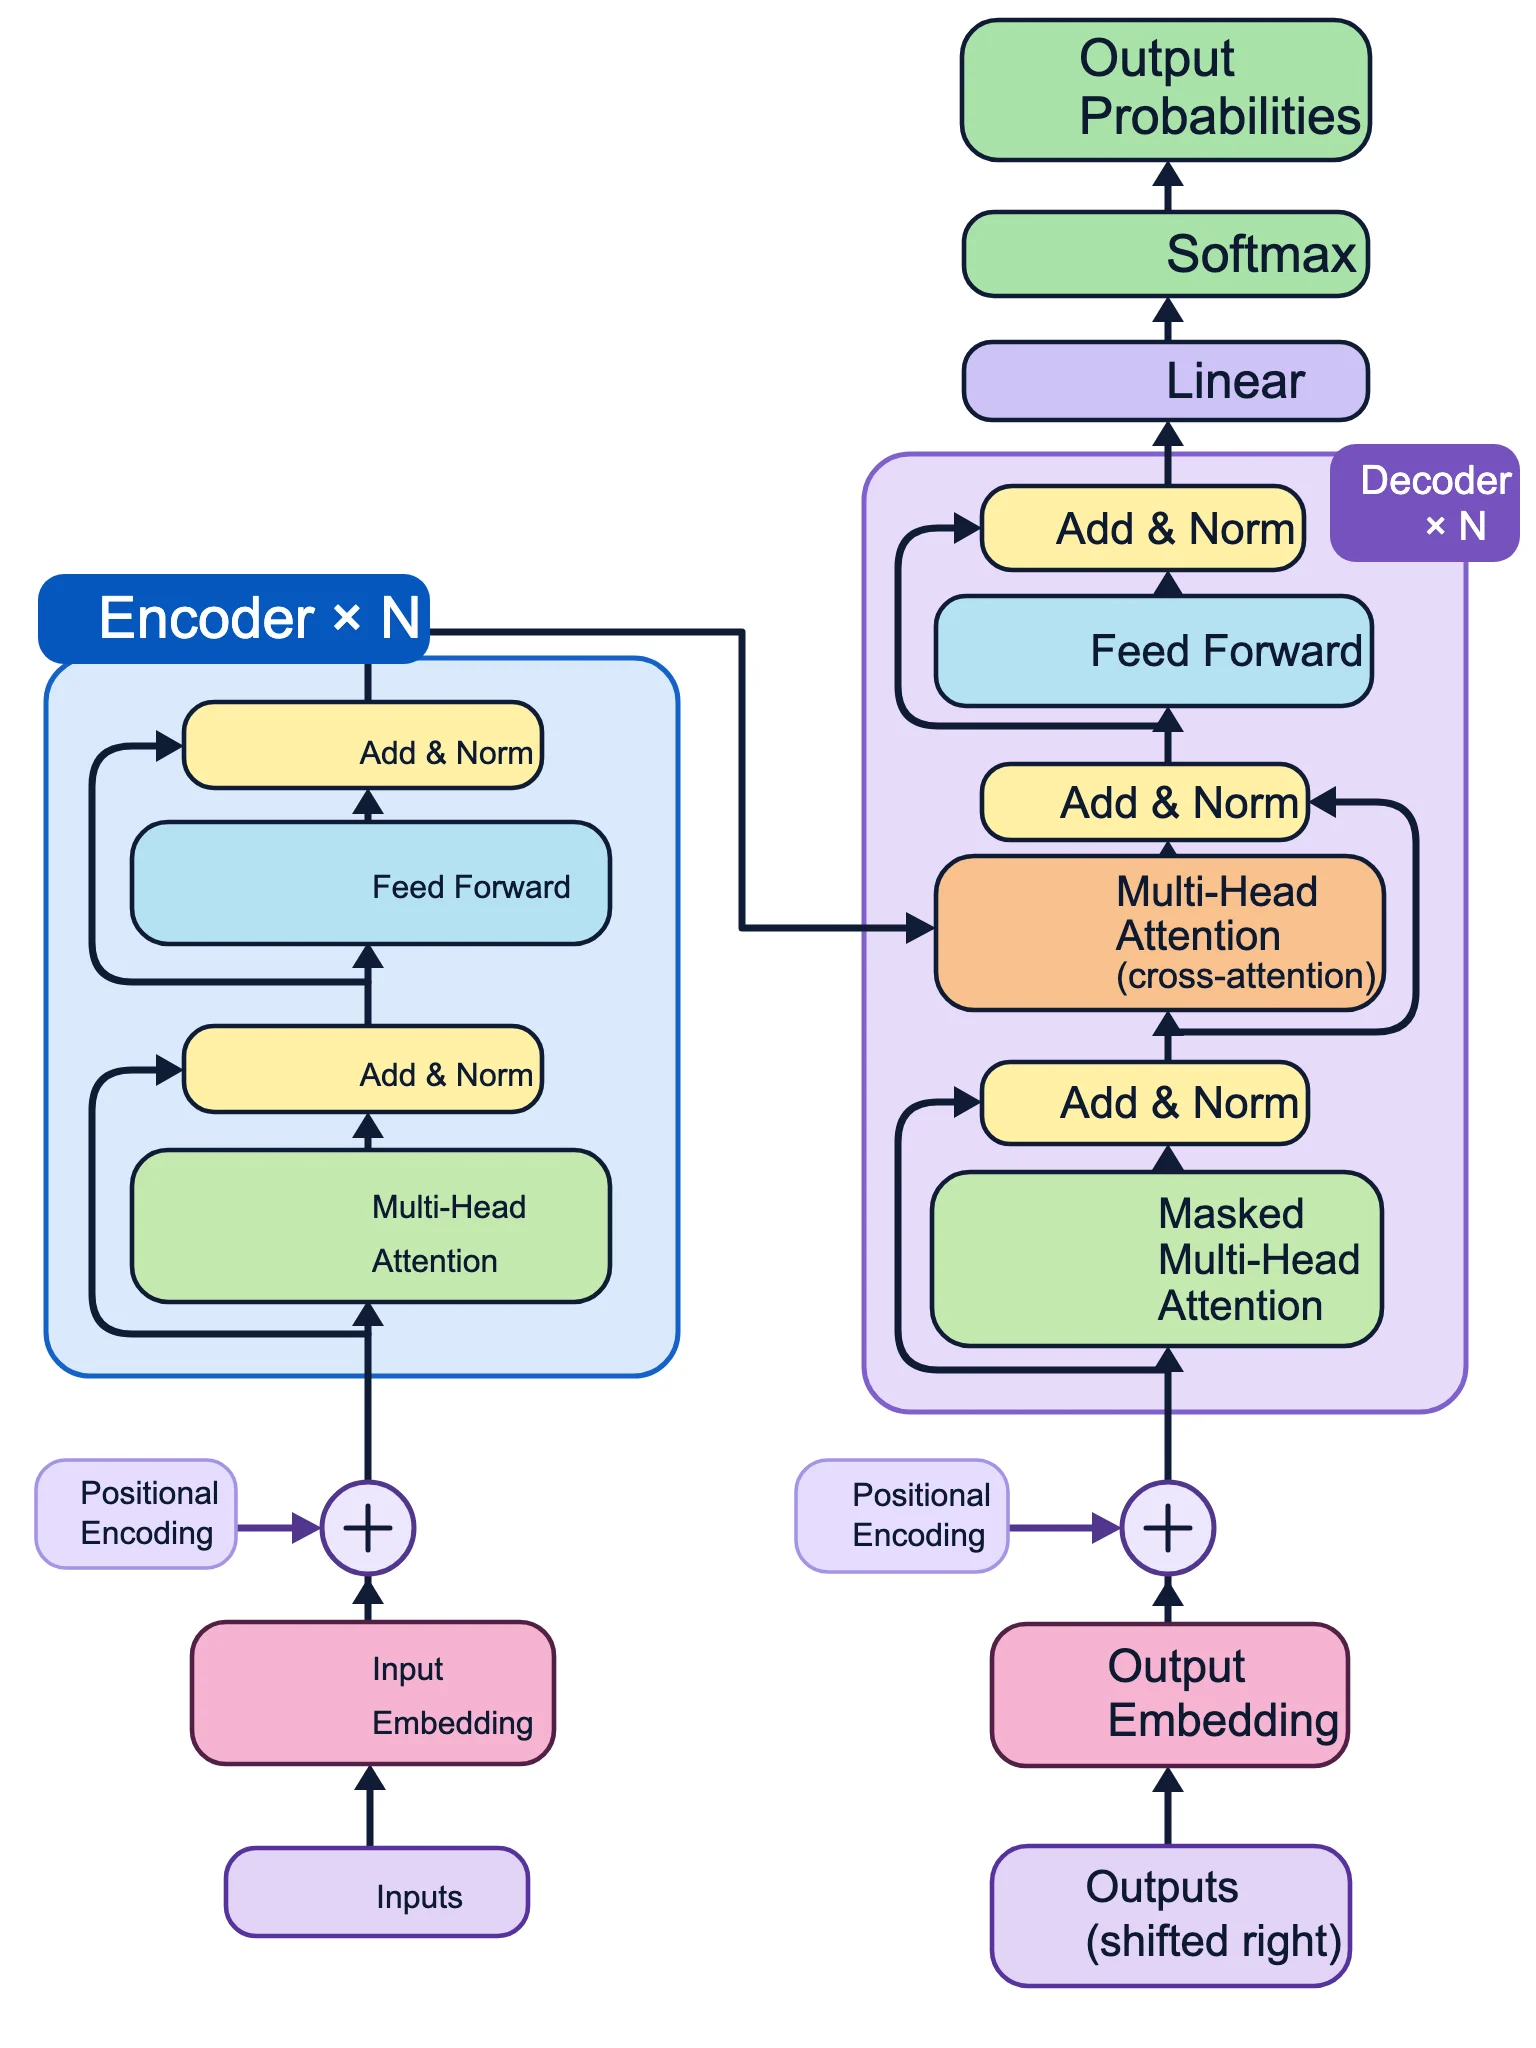
Machine learning paper figure, clean flat vector architecture diagram on white background: the Transformer encoder-decoder model. Left stack 'Encoder ×N': Input Embedding, Positional Encoding (⊕), Multi-Head Attention, Add & Norm, Feed Forward, Add & Norm. Right stack 'Decoder ×N': Output Embedding (shifted right), Positional Encoding, Masked Multi-Head Attention, Add & Norm, Multi-Head Attention (cross-attention from encoder), Add & Norm, Feed Forward, Add & Norm, then Linear, Softmax, Output Probabilities. Rounded rectangles in pastel colors, residual connection arrows, sans-serif labels.
 SciDiagram
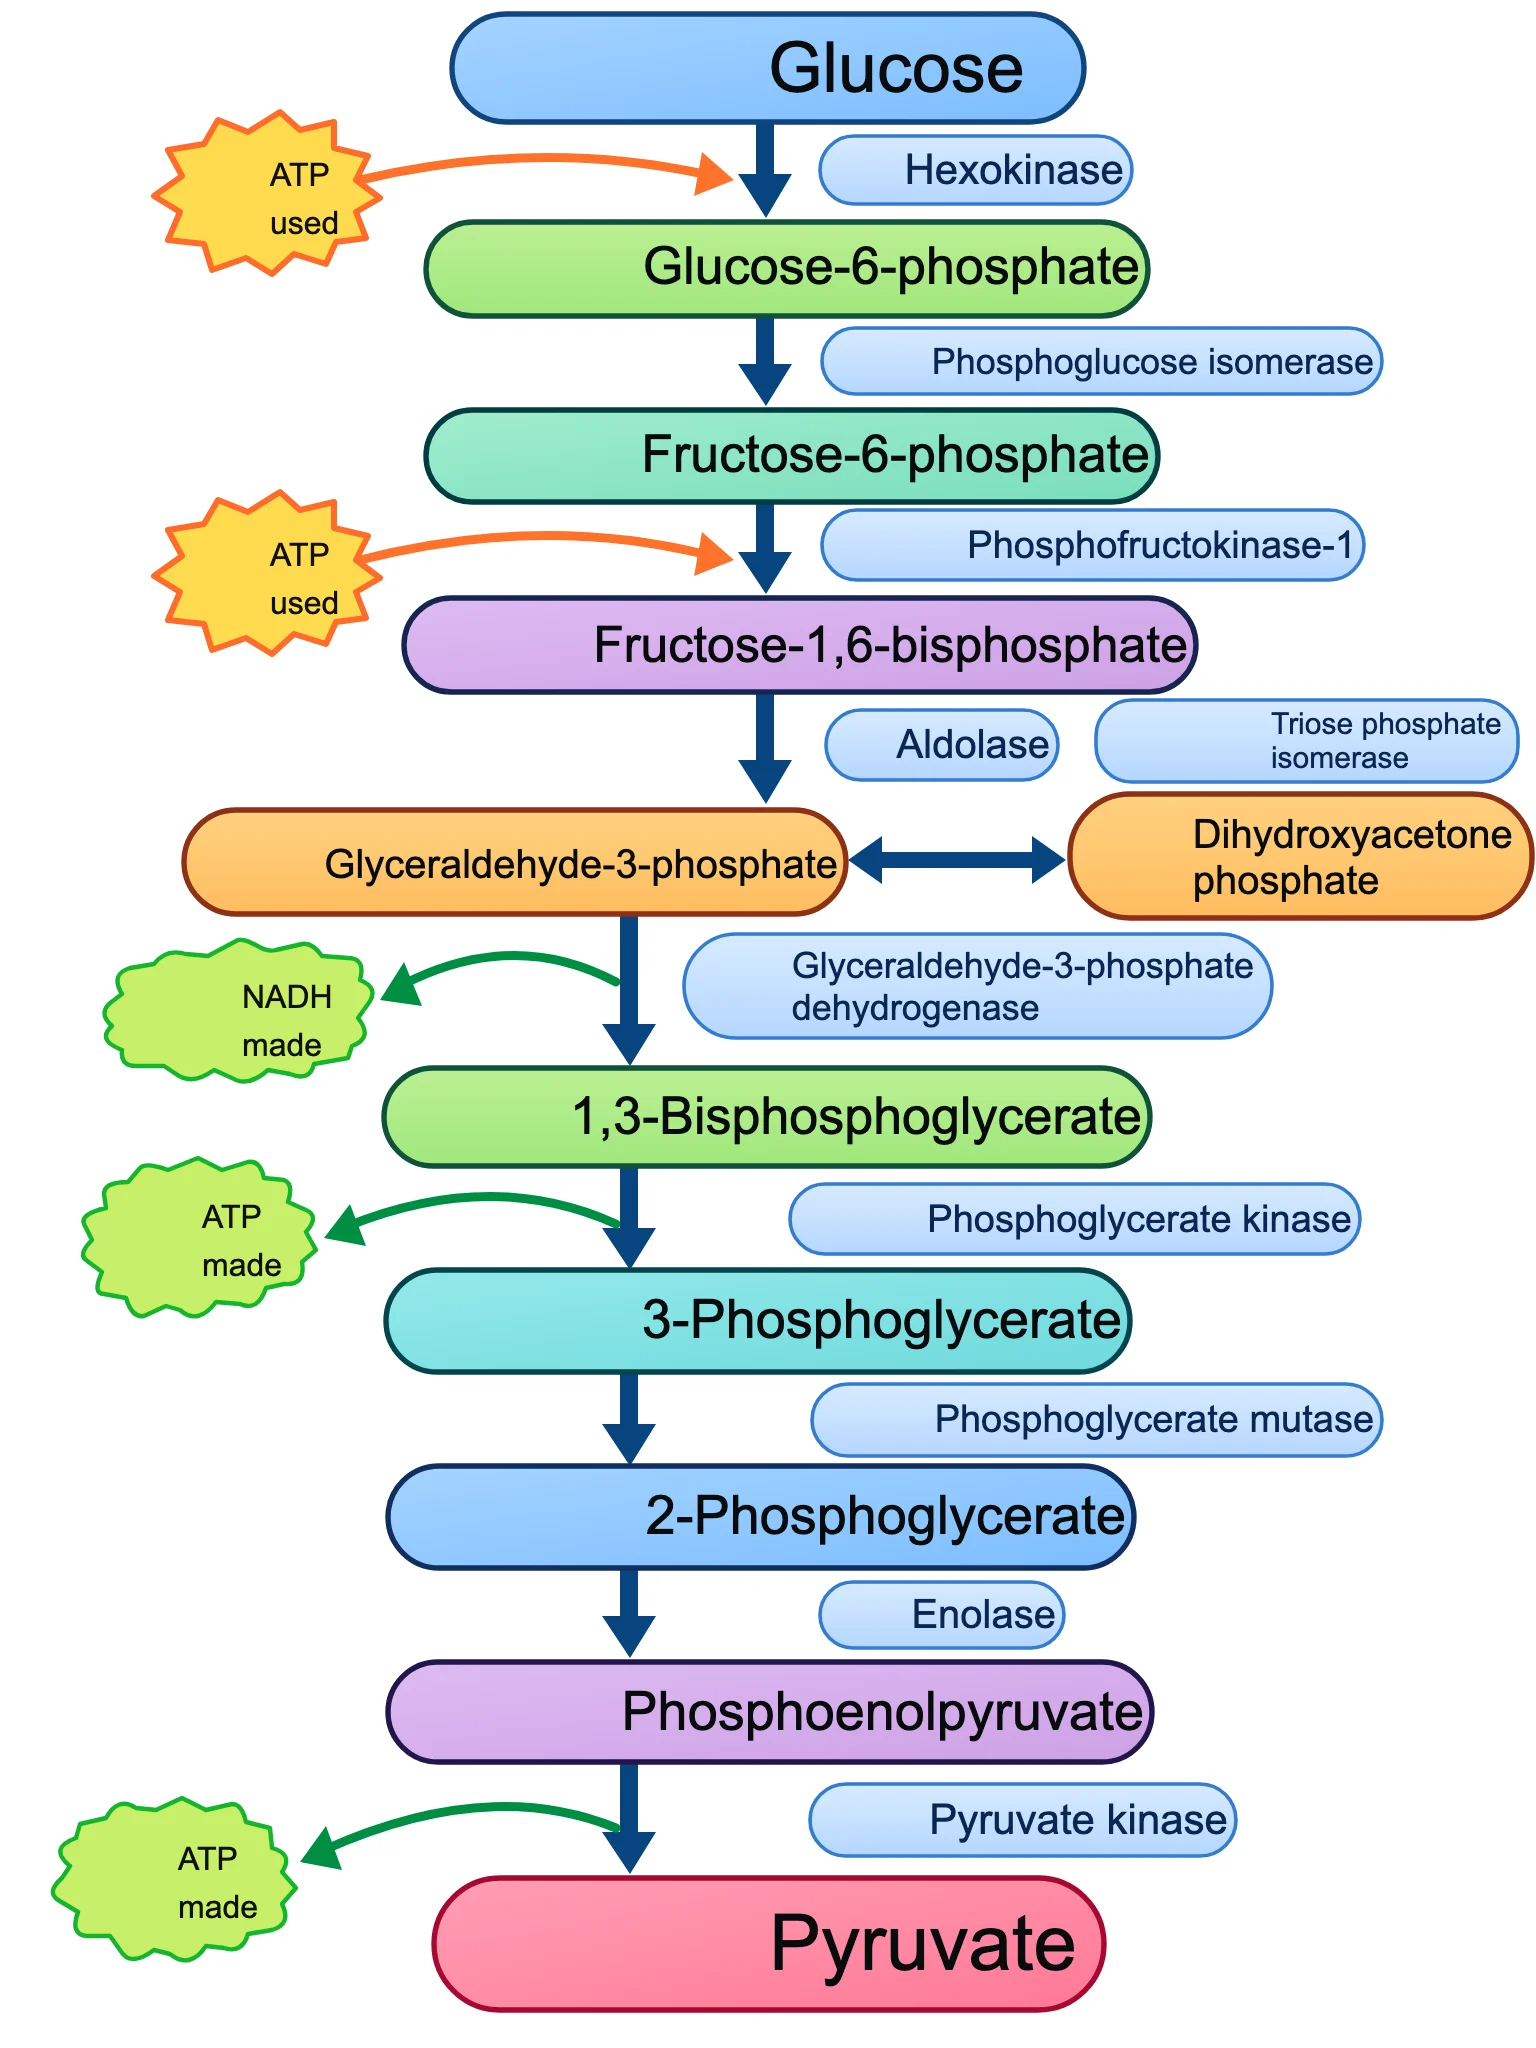
Biochemistry figure, clean flat vector pathway diagram on white background: the 10 steps of glycolysis as a vertical chain of molecule names connected by arrows. Molecules in order: Glucose, Glucose-6-phosphate, Fructose-6-phosphate, Fructose-1,6-bisphosphate, Glyceraldehyde-3-phosphate (with Dihydroxyacetone phosphate branch), 1,3-Bisphosphoglycerate, 3-Phosphoglycerate, 2-Phosphoglycerate, Phosphoenolpyruvate, Pyruvate. Label each arrow with its enzyme: Hexokinase, Phosphoglucose isomerase, Phosphofructokinase-1, Aldolase, Triose phosphate isomerase, Glyceraldehyde-3-phosphate dehydrogenase, Phosphoglycerate kinase, Phosphoglycerate mutase, Enolase, Pyruvate kinase. Mark ATP used (steps 1 and 3), NADH made (step 6), ATP made (steps 7 and 10) as small side arrows.
 SciDiagram
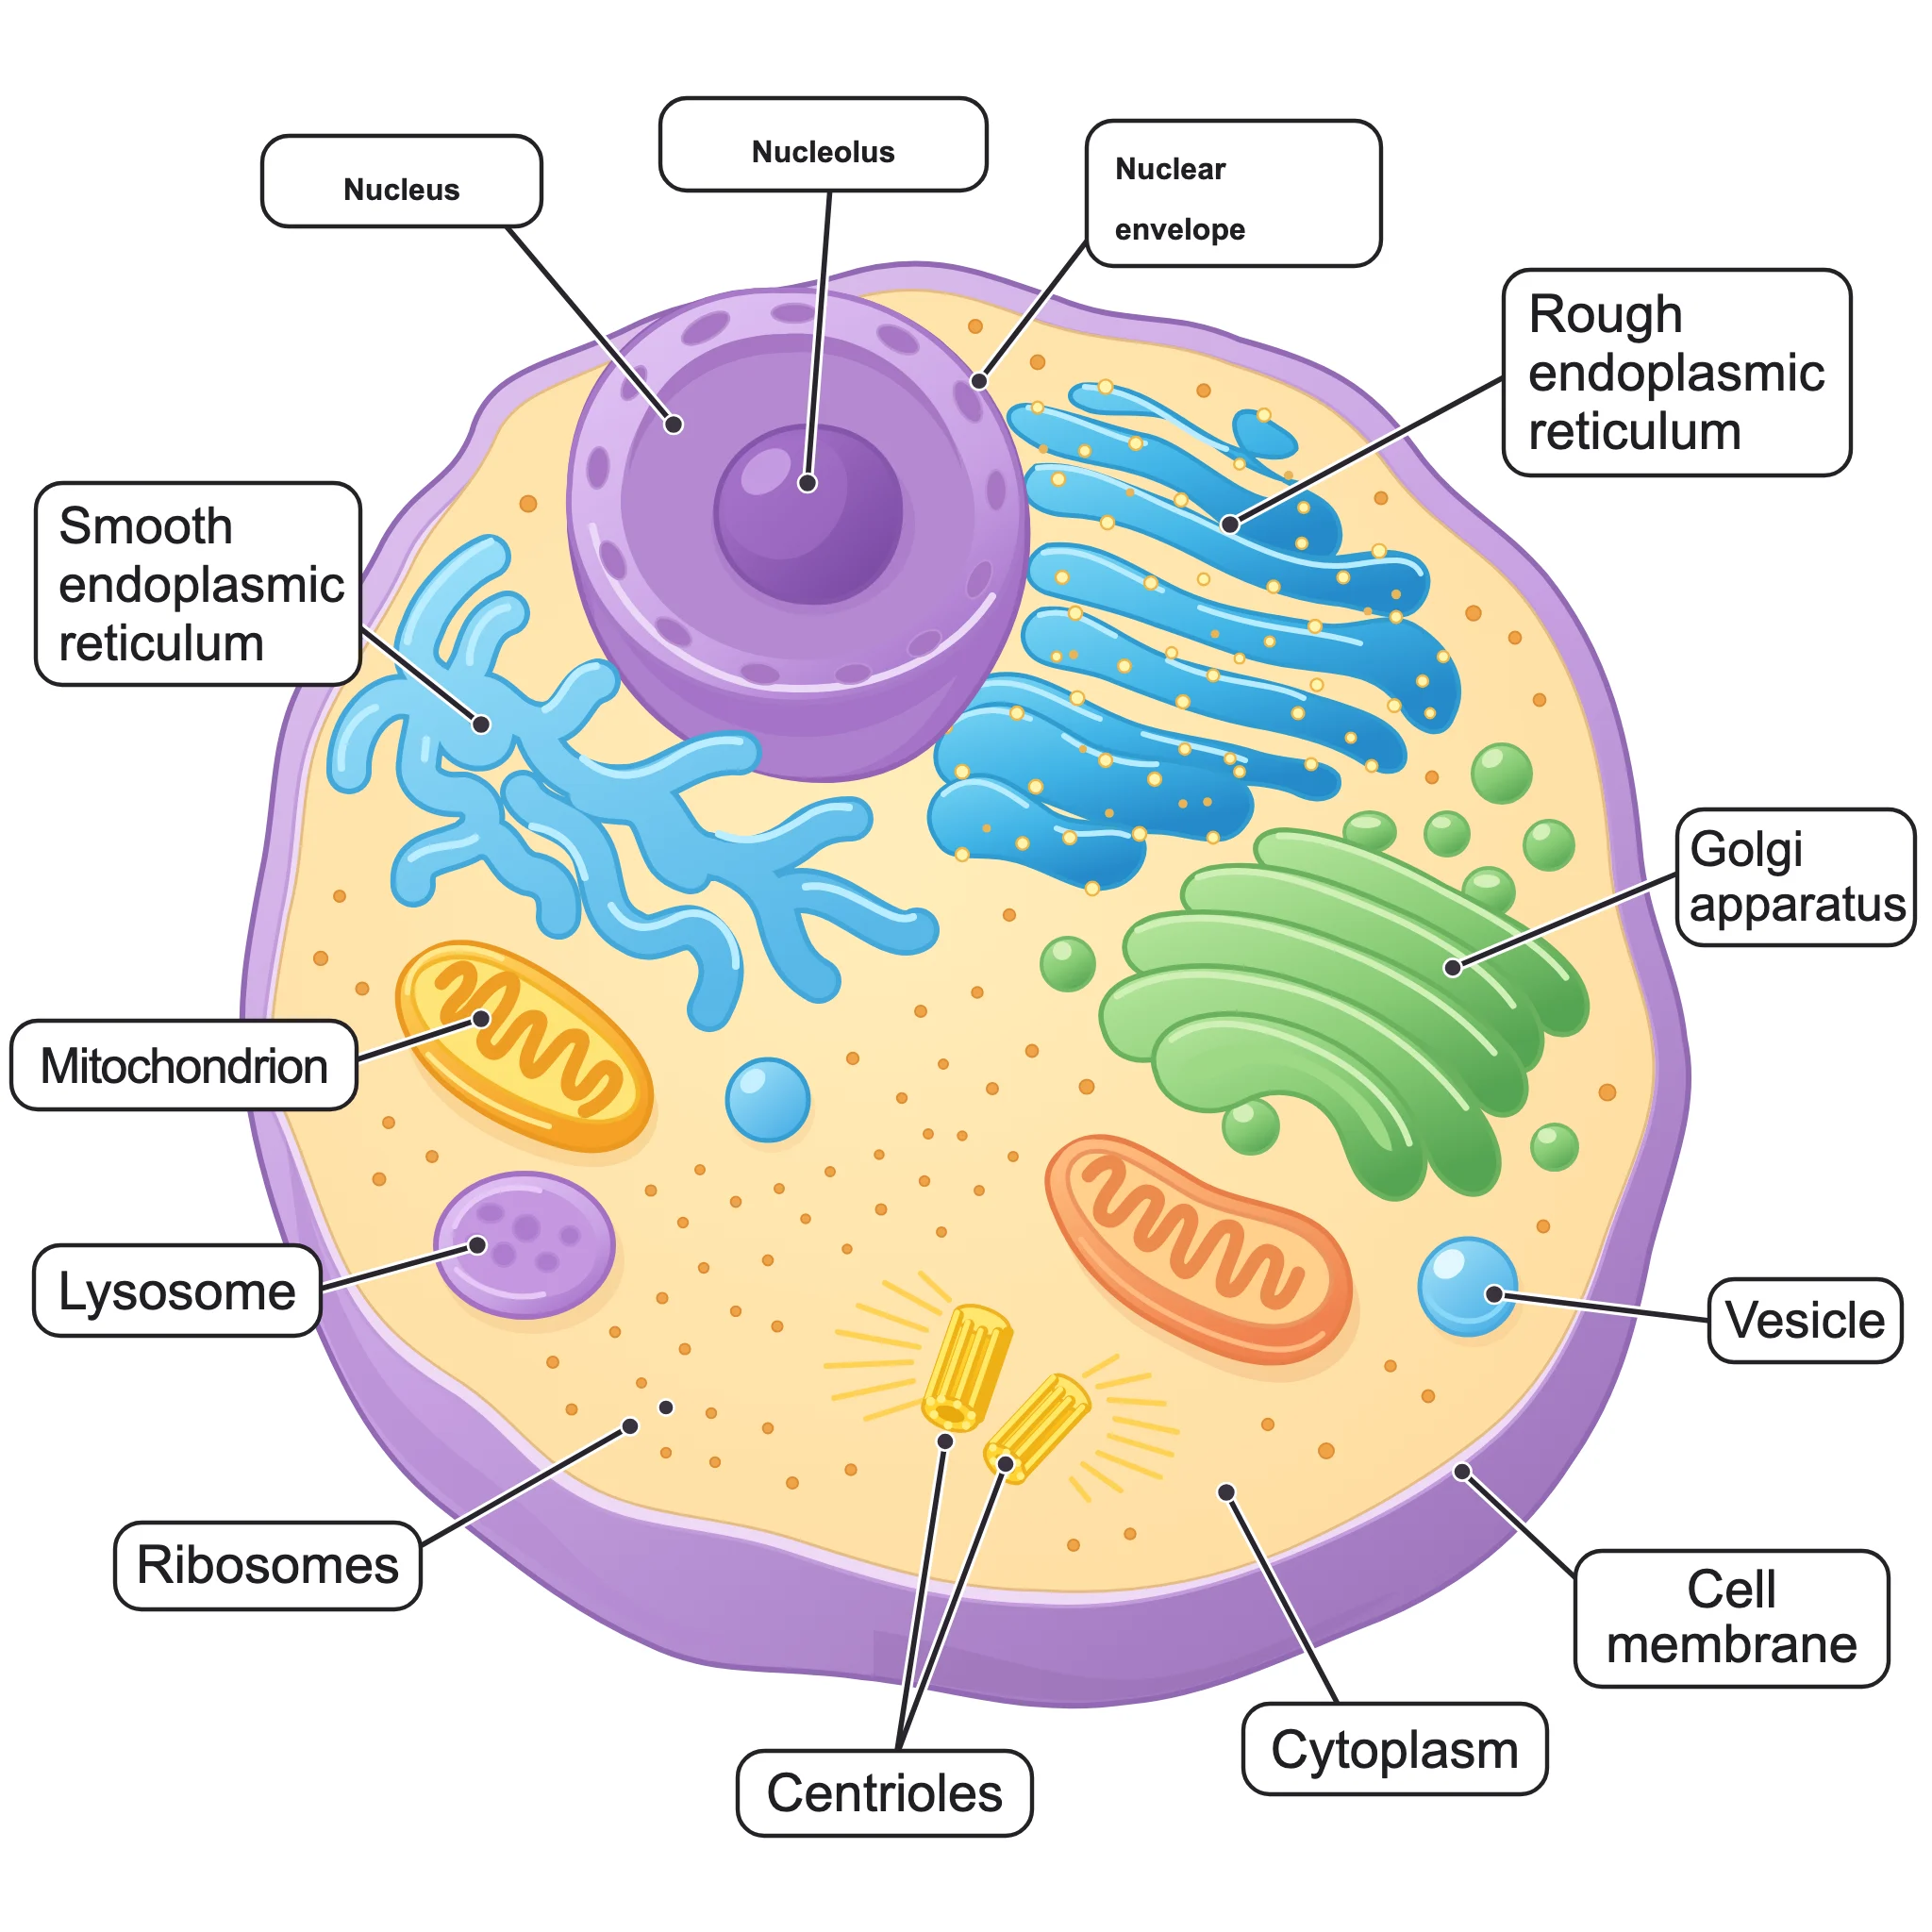
Biology textbook labeled diagram of an animal cell, cross-section, flat clean vector illustration with soft pastel colors on white background. Clear leader lines to labels: Nucleus, Nucleolus, Nuclear envelope, Rough endoplasmic reticulum, Smooth endoplasmic reticulum, Golgi apparatus, Mitochondrion, Lysosome, Ribosomes, Centrioles, Cell membrane, Cytoplasm, Vesicle. Sans-serif labels placed outside the cell.
 SciDiagram
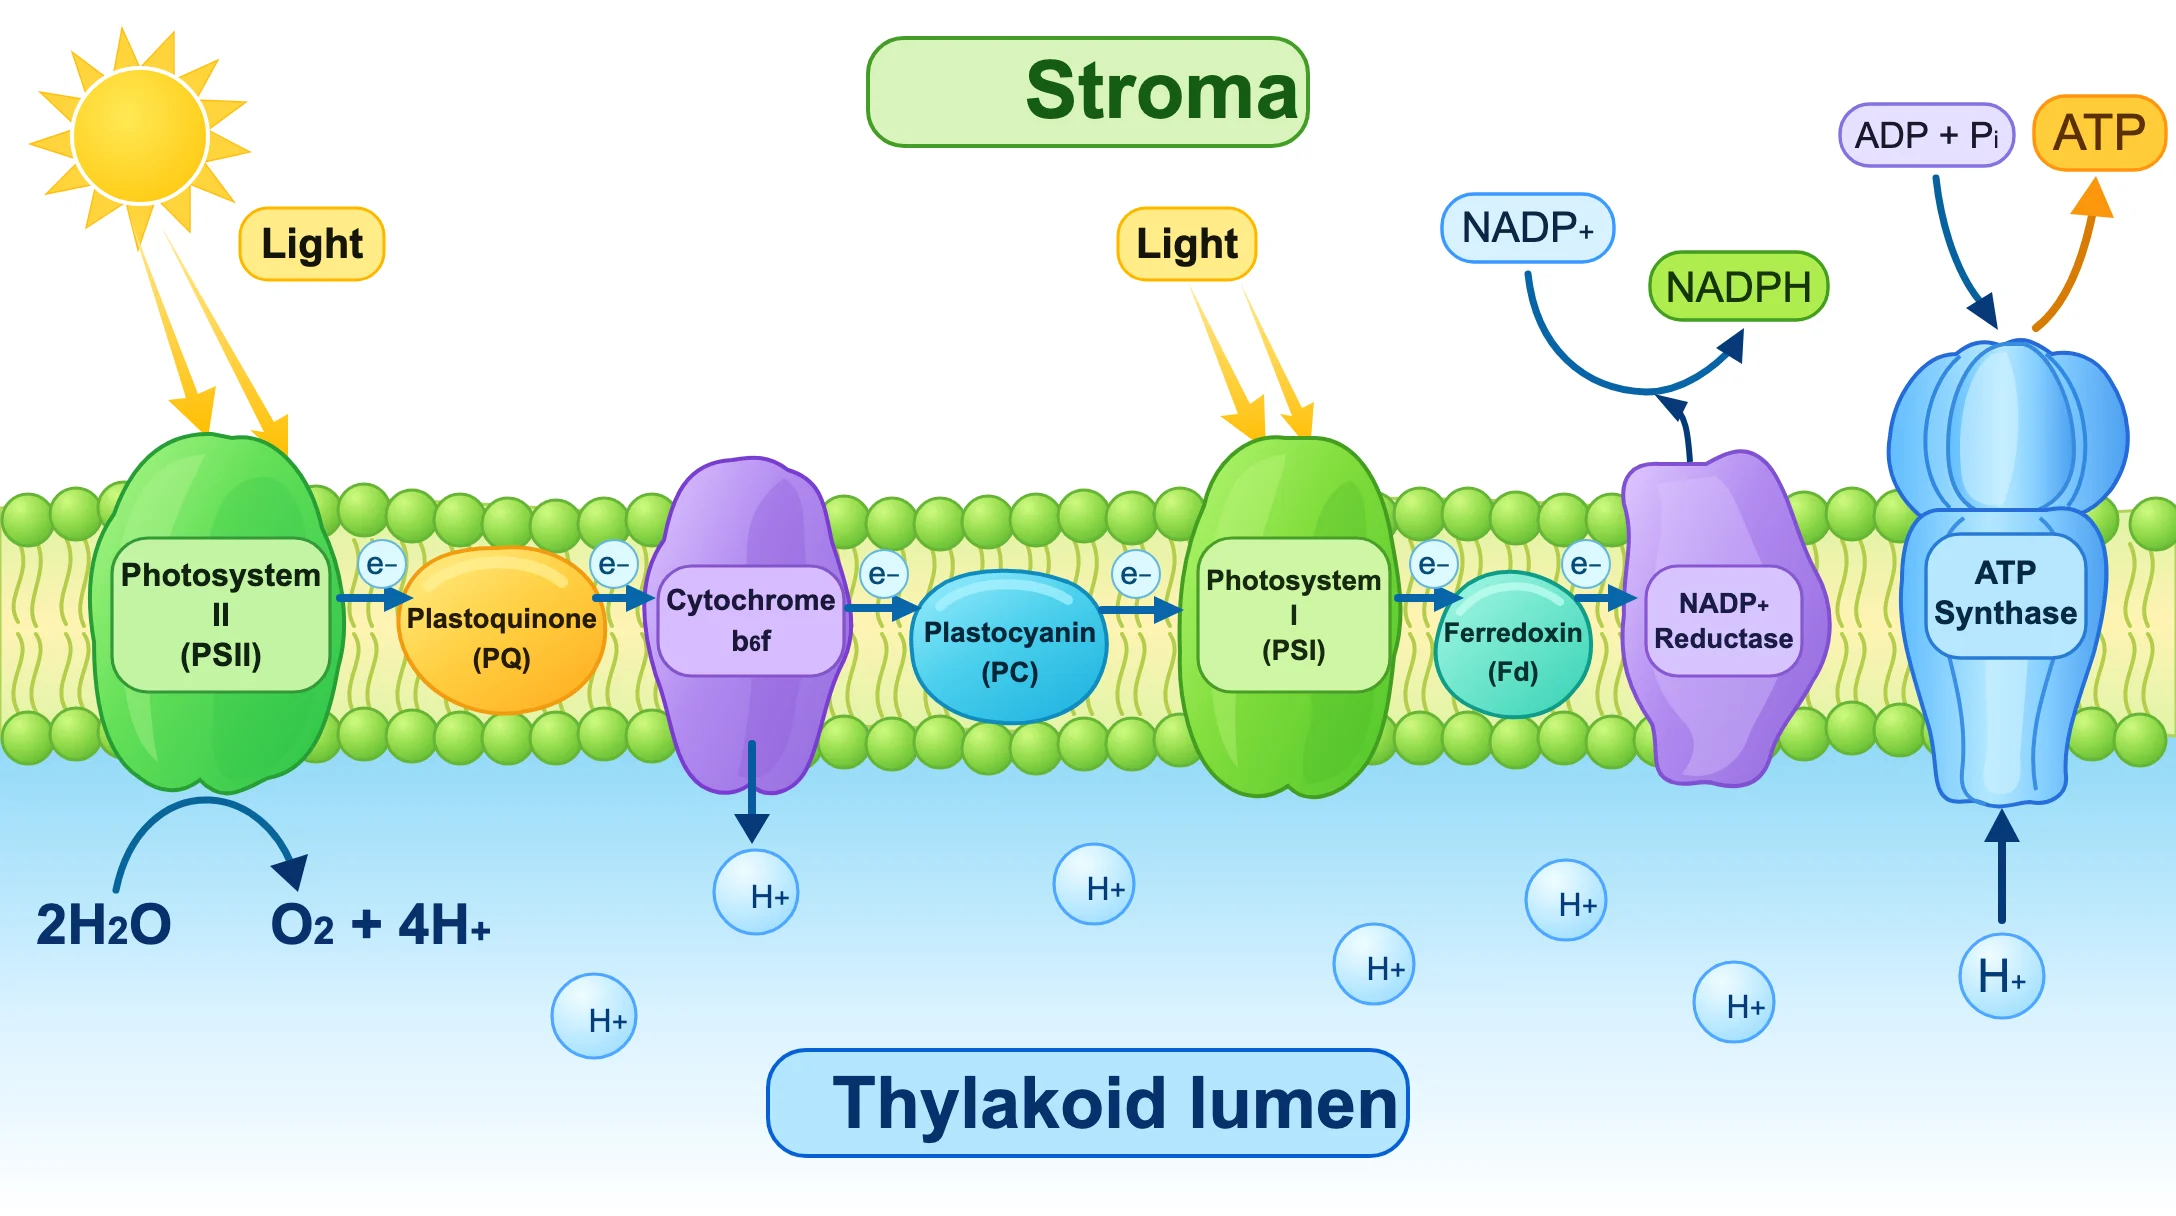
Plant biology diagram, flat clean vector scientific illustration on white background: the light-dependent reactions in the thylakoid membrane. Label 'Stroma' above and 'Thylakoid lumen' below the membrane. Embedded complexes from left to right: Photosystem II, Plastoquinone (PQ), Cytochrome b6f, Plastocyanin (PC), Photosystem I, Ferredoxin (Fd), NADP+ reductase, ATP synthase. Show light hitting PSII and PSI, water splitting 2H2O → O2 + 4H+ in the lumen, electron flow arrows (e−), H+ pumped into the lumen, NADP+ → NADPH in the stroma, and ADP + Pi → ATP at ATP synthase.